
- 1. Why analytics matter
- 2. Understanding core metrics
- Pageviews
- Visitors
- 3. Decoding the 11 report types (Tab-by-Tab)
- 1. Overview
- 2. Countries
- 3. Cities
- 4. Devices
- 5. Operating systems (OS)
- 6. Browsers
- 7. Languages
- 8. Referrer hosts
- 9. Referrer paths
- 10. Marketing campaigns (UTM)
- 11. Entries (Detailed logs)
- 4. Using UTM parameters like a pro
- UTM lookup table:
- 5. Data management and export
- 6. Data retention and automated maintenance
- Retention periods by plan
- Unique visitor identification logic
- 7. Frequently Asked Questions (FAQ)
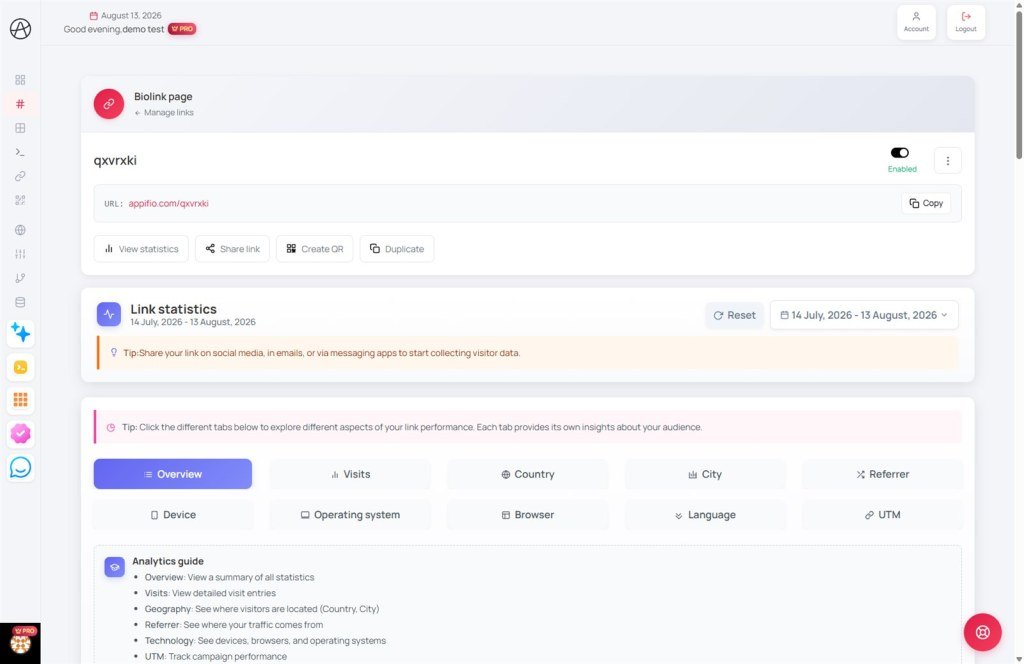
Analytics Control Center
Learn how to harness the power of Statistics (Analytics) data to understand your customers and optimize business conversions.
1. Why analytics matter
Running an online business without analytics is like driving at night without headlights. Appifio's Analytics system helps you answer three vital questions:
- Internal Analytics: Data collected by Appifio and displayed on your dashboard (clicks, devices, countries).
- How do they find me? (Via social media, search, or offline QR codes).
- What interests them most? (Which links get clicked, which content grabs attention).
2. Understanding core metrics
Before diving into detailed reports, distinguish between the two most important concepts in Appifio's tracking system:
Pageviews
The total number of times your link has been loaded in a browser. Every refresh or revisit counts as a new pageview.
Value: Measures overall reach and repeated engagement.
Visitors
The number of unique individuals who have accessed your link. We use cookies and IP identification to ensure that one person clicking ten times in 24 hours is counted as only one visitor.
Value: Measures the actual number of unique potential customers reached.
3. Decoding the 11 report types (Tab-by-Tab)
Each report in Appifio provides a different lens through which to view customer behavior:
1. Overview
Displays: Real-time traffic charts and aggregated totals.
Application: Identify your "golden hours." If traffic peaks between 8 PM and 10 PM, schedule your posts or ads during this window for maximum impact.
2. Countries
Data: Geographic identification based on visitor IP addresses.
Application: Identify key markets. If you're a local business seeing high international traffic, it might indicate bot activity or a misaligned ad target.
3. Cities
Data: Pinpoints the specific cities of your users.
Application: Crucial for physical shops or local delivery services. Use this to decide where to open new branches or focus local ad spend.
4. Devices
Data: Categorizes users into Desktop, Mobile, or Tablet.
Application: If 90% of your users are on mobile, ensure your content is concise, images are vertical-friendly, and buttons are large enough for thumb-taps.
5. Operating systems (OS)
Data: Identifies iOS, Android, Windows, macOS, etc.
Application: Infer purchasing power. For example, a high percentage of iPhone users often correlates with higher-tier consumer segments.
6. Browsers
Data: Chrome, Safari, in-app browsers like Facebook or Zalo.
Application: Understand which apps are driving your traffic (e.g., clicks from Zalo messages show up as Zalo Browser) to tailor your messaging.
7. Languages
Data: Preferred language settings on the user's browser.
Application: If you see a surge in English-speaking users, consider adding multilingual content to capture international sales.
8. Referrer hosts
Data: The domains that directed visitors to your link.
Application: Identify which social platforms or websites are providing free referral traffic (TikTok, YouTube, Google) to build long-term partnerships.
9. Referrer paths
Data: Specific URLs of source pages.
Application: Find the exact blog post or article mentioning you so you can engage with the author or measure the effectiveness of that specific shout-out.
10. Marketing campaigns (UTM)
Data: Source, Medium, and Campaign parameters attached to your links.
Application: The ultimate ROI measurement tool. Compare performance between different influencers (KOL A vs. KOL B) or ad creatives to see which actually converts.
11. Entries (Detailed logs)
Displays: A real-time chronological list of every individual click.
Application: Monitor individual user journeys or detect early signs of spam or malicious clicking from competitors.
4. Using UTM parameters like a pro
UTMs are small tags added to the end of a link to "track" traffic sources. A typical link with UTMs looks like this:
https://appifio.com/yourname?utm_source=facebook&utm_medium=post&utm_campaign=summer_saleUTM lookup table:
| Parameter | Simplified explanation | Example |
|---|---|---|
| utm_source | Who sent the traffic? | facebook, tiktok, newsletter |
| utm_medium | How did they send it? | ads, bio_link, video_description |
| utm_campaign | Which specific event? | black_friday_2026, launch_promo |
The golden rules of UTM:
- Always use lowercase: The system treats
Facebookandfacebookas two different sources. - No spaces or special characters: Use underscores
_instead of spaces to avoid broken links. - Be consistent: Standardize your naming conventions so your reports remain organized over time.
5. Data management and export
Your data is a valuable asset. Appifio provides the tools to manage and archive it:
- Time-based filtering: View stats for Today, Yesterday, Last 7 Days, Last 30 Days, or a custom range.
- Export: Download your reports as CSV (Excel) or JSON for permanent storage or external analysis.
- Reset stats: Clear all historical data to start tracking a fresh campaign from scratch.
6. Data retention and automated maintenance
Appifio operates a smart maintenance engine to ensure the fastest possible page loads. Here are the background logics you should know:
Retention periods by plan
Statistics are not stored indefinitely but depend on your subscription tier:
- Free plan: Typically stores data for 30-90 days.
- Paid plans: Extended retention, up to 365 days or unlimited depending on the tier.
- Automated cleanup: Our system runs a daily maintenance process that checks account limits and automatically prunes expired records to keep the system lean and fast.
Unique visitor identification logic
To ensure accuracy and prevent artificial inflation, we apply several technical filters:
- Identification cookies: When a user visits, we send a unique identifier to their browser. Subsequent clicks from that same browser within 24 hours are not counted as new unique visitors.
- Rate limiting: To protect resources and prevent spam, the system stops recording views if a single browser exceeds 3 visits to the same link within a very short interval.
- Bot detection: We use an advanced device identification library to filter out search engine crawlers (Googlebot, Bingbot) and automated scripts from your reports.
- Preview exclusion: When you are logged in and viewing your own pages via the "Preview" button, the system identifies you and excludes those visits from the statistics to keep your data pure.
7. Frequently Asked Questions (FAQ)
Why are my numbers different from Google Analytics?
Every system defines "Visitors" differently. Appifio focuses on direct, real-time click recording, whereas Google Analytics uses more complex asynchronous filtering. A discrepancy of 5-10% is perfectly normal.
How long is my data kept?
Retention depends on your specific Plan. Check your plan settings to see the exact number of days your data is stored before the automated cleanup.
© 2026 Appifio Creator. Official system documentation.
